
- Marketing, Advertising, Sales & PR
- Accounting, Taxation, and Reporting
- Professionalism & Career Development
-
Law, Transactions, & Risk Management
Government, Legal System, Administrative Law, & Constitutional Law Legal Disputes - Civil & Criminal Law Agency Law HR, Employment, Labor, & Discrimination Business Entities, Corporate Governance & Ownership Business Transactions, Antitrust, & Securities Law Real Estate, Personal, & Intellectual Property Commercial Law: Contract, Payments, Security Interests, & Bankruptcy Consumer Protection Insurance & Risk Management Immigration Law Environmental Protection Law Inheritance, Estates, and Trusts
- Business Management & Operations
- Economics, Finance, & Analytics
What is an S-Curve?
The S curve refers to the shape of charted data on a line graph that represents the growth of a business. The plotted line has a distinct S shape.
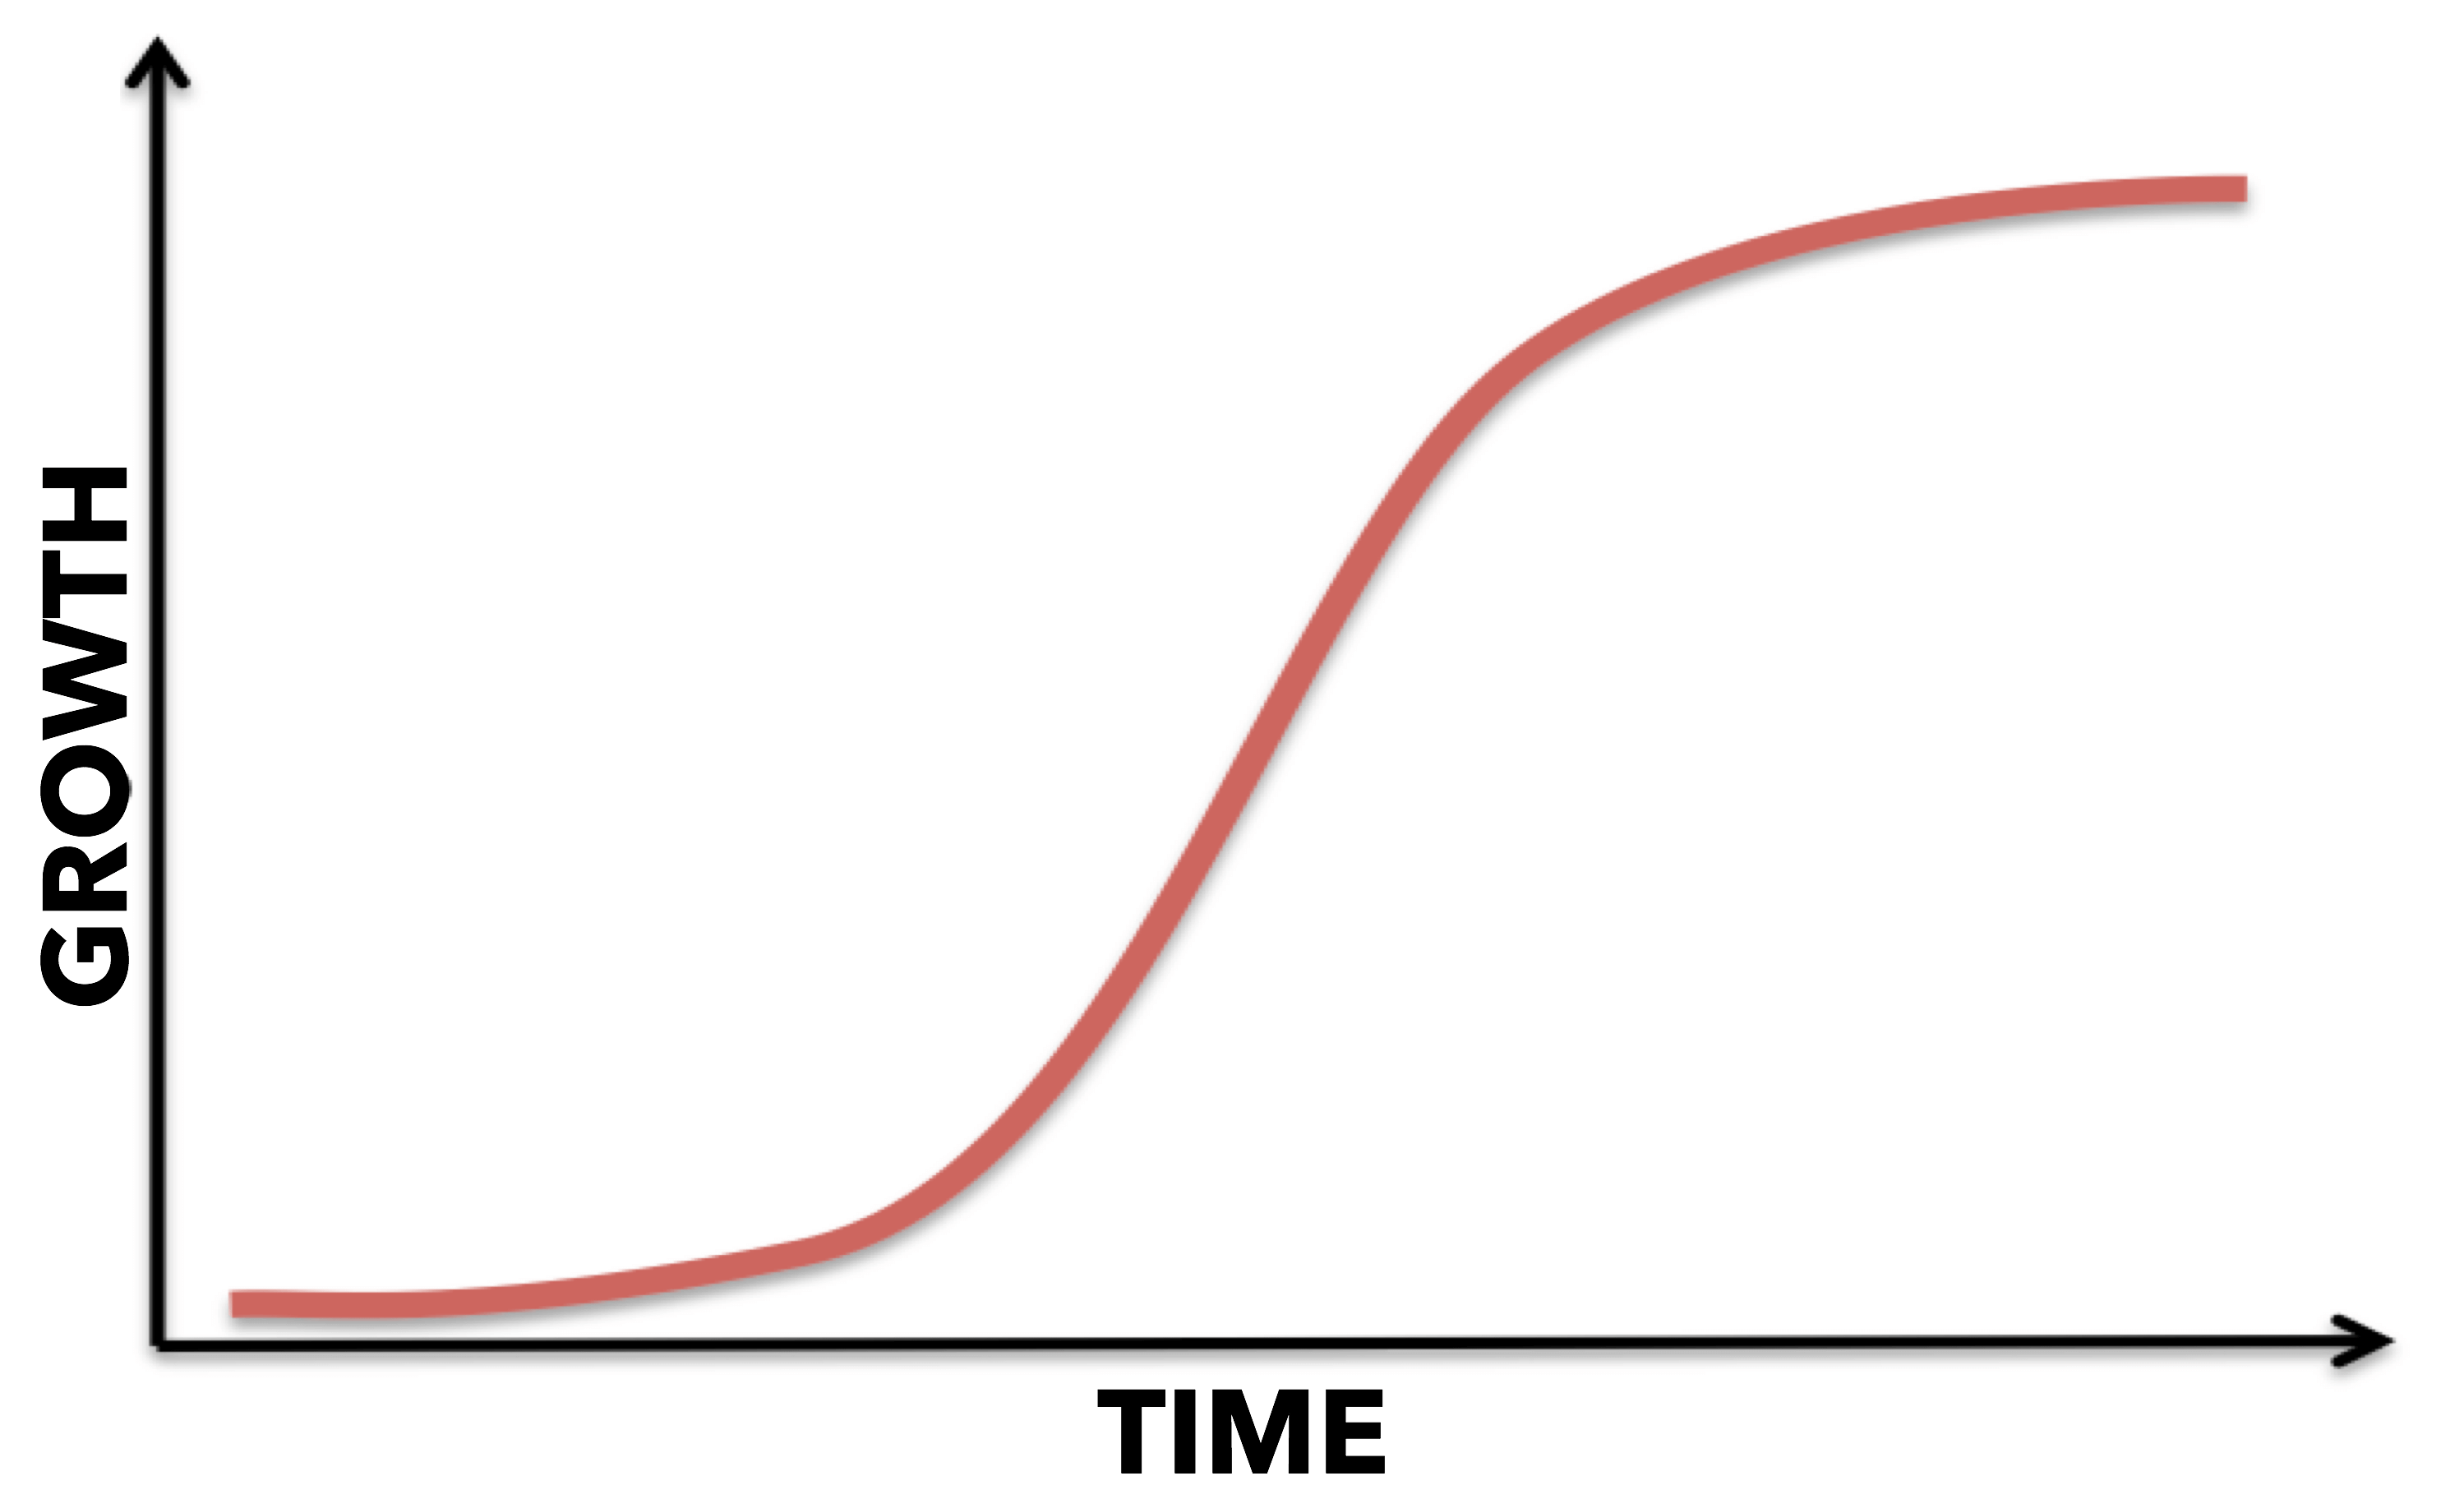
How is the S-Curve Used?
The S curve is used to describe, visualize, and predict the growth of a project or business. More specifically, it is a logistic curve that plots the progress of a variable (growth) by relating it to another variable (time).
What Does the S-Curve Mean?
The S curve demonstrate growth. Projects on the S curve often experience a slow or low growth at the beginning, rapid growth in the middle, and slow growth and at the end.
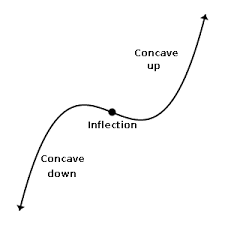
What is the Point of Inflection?
The maximum point of acceleration is called the point of inflection. It is at this point on the graph where the curve changes from concave (upward sloping) to convex (downward sloping). On the S curve it demonstrate where the rate of growth begins to slow.
What Businesses Follow the S-Curve?
Startup businesses (growth-based businesses) traditionally follow a S growth curve. After development and finding product-market fit, the scalable repeatable business model is capable of rapid growth.
Back to: STRATEGY, ENTREPRENEURSHIP, & INNOVATION