Supply Curve (Economics) - Explained
What is the Supply Curve?

Written by J. Mance Gordon
Updated at April 23rd, 2024
- Marketing, Advertising, Sales & PR
- Accounting, Taxation, and Reporting
- Professionalism & Career Development
-
Law, Transactions, & Risk Management
Government, Legal System, Administrative Law, & Constitutional Law Legal Disputes - Civil & Criminal Law Agency Law HR, Employment, Labor, & Discrimination Business Entities, Corporate Governance & Ownership Business Transactions, Antitrust, & Securities Law Real Estate, Personal, & Intellectual Property Commercial Law: Contract, Payments, Security Interests, & Bankruptcy Consumer Protection Insurance & Risk Management Immigration Law Environmental Protection Law Inheritance, Estates, and Trusts
- Business Management & Operations
- Economics, Finance, & Analytics
What is the Supply Curve?
The supply curve refers to a graph showcasing the relationship between the cost of a product or service, and its supply for a specific period of time.
When allocating points in a graph, the vertical axis represents the price, while the horizontal axis represents the quantity supplied.
What is the Shape of the Supply Curve on a Graph?
The supply curve has two variables concerning production of a good - quantity and price.
The supply curve moves in an upward direction from left to right. This is also referred to as the law of supply.
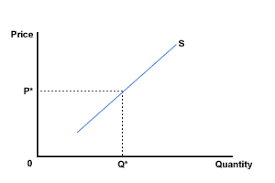
With the increase in the price of a product, its supply also increases, provided all other things remain constant.
Here, the price remains to be independent, while the quantity stays dependent.
Usually, the independent attribute is positioned on the horizontal axis, which tends to exceptional in this case.
Factors Affecting the Supply Curve
Supply curves routinely shift based upon changes in the market.
An increase the production (for any reason, such as more access to resources, new technology, etc.) of the product will, irrespective of the price remaining constant, will lead to the supply curve shifting to the right.
There are many other variables such as the production price that can shift the supply curve from its initial position.
The supply curve will encounter a left shift when the cost of production increase.
In case, the price of the substitute good increases, the producer will be more tempted to produce it, which will negatively affect the production of the original product. This will result in lower production levels and curve will shift to the left shift.
In summary, other variables such as changes in technology, increased production levels, can also result in the right shifting of the supply curve. Besides, market expectations as well as the extent of competition can also result in changes in the supply curve.
Related Topics
- Self Interest
- Cost-Benefit Analysis
- Enlightened Self-Interest
- Fisher's Separation Theorem
- Ratchet Effect
- Total Utility (Economics)
- Efficiency Principle
- Expected Utility
- Subjective Theory of Value
- Positional Goods
- Utilitarianism
- Indifference Curve
- Time Preference Theory of Interest
- Incentives
- Marginal Benefit
- Diminishing Marginal Utility
- Sunk Costs
- Production Possibilities Frontier
- Law of Diminishing Returns
- Economic Efficiency
- Efficiency Theory
- Productive Efficiency
- Capacity Utilization Rate
- Allocative Efficiency
- Pareto Efficient
- Comparative Advantage
- Criticisms of the Economic Approach
- Behavioral Economics
- Normative Economics
- Positive Economics
- Invisible Hand
- Sunk cost