Keynesian, Intermediate, and Neoclassical Zones
What are the Keynesian, Intermediate, and Neoclassical Zones in the Aggregate Supply Aggregate Demand Model?
- Marketing, Advertising, Sales & PR
- Accounting, Taxation, and Reporting
- Professionalism & Career Development
-
Law, Transactions, & Risk Management
Government, Legal System, Administrative Law, & Constitutional Law Legal Disputes - Civil & Criminal Law Agency Law HR, Employment, Labor, & Discrimination Business Entities, Corporate Governance & Ownership Business Transactions, Antitrust, & Securities Law Real Estate, Personal, & Intellectual Property Commercial Law: Contract, Payments, Security Interests, & Bankruptcy Consumer Protection Insurance & Risk Management Immigration Law Environmental Protection Law Inheritance, Estates, and Trusts
- Business Management & Operations
- Economics, Finance, & Analytics
What are the Keynesian, Intermediate, and Neoclassical Zones in the Aggregate Supply Aggregate Demand Model?
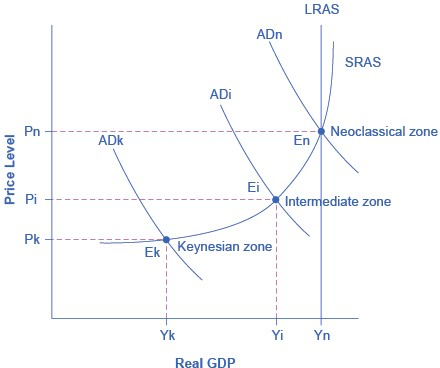
We can use the AD/AS model to illustrate both Say’s law that supply creates its own demand and Keynes’ law that demand creates its own supply. Consider the SRAS curve's three zones, known as: the Keynesian zone, the neoclassical zone, and the intermediate zone.

Near the equilibrium Ek, in the Keynesian zone at the far left of the SRAS curve, small shifts in AD, either to the right or the left, will affect the output level Yk, but will not much affect the price level. In the Keynesian zone, AD largely determines the quantity of output. Near the equilibrium En, in the neoclassical zone at the SRAS curve's far right, small shifts in AD, either to the right or the left, will have relatively little effect on the output level Yn, but instead will have a greater effect on the price level. In the neoclassical zone, the near-vertical SRAS curve close to the level of potential GDP largely determines the quantity of output. In the intermediate zone around equilibrium Ei, movement in AD to the right will increase both the output level and the price level, while a movement in AD to the left would decrease both the output level and the price level.
Focus first on the. Keynesian zone, that portion of the SRAS curve on the far left which is relatively flat. If the AD curve crosses this portion of the SRAS curve at an equilibrium point like Ek, then certain statements about the economic situation will follow. In the Keynesian zone, the equilibrium level of real GDP is far below potential GDP, the economy is in recession, and cyclical unemployment is high. If aggregate demand shifted to the right or left in the Keynesian zone, it will determine the resulting level of output (and thus unemployment). However, inflationary price pressure is not much of a worry in the Keynesian zone, since the price level does not vary much in this zone.
Now, focus your attention on the neoclassical zone of the SRAS curve, which is the near-vertical portion on the right- hand side. If the AD curve crosses this portion of the SRAS curve at an equilibrium point like En where output is at or near potential GDP, then the size of potential GDP pretty much determines the level of output in the economy.
Since the equilibrium is near potential GDP, cyclical unemployment is low in this economy, although structural unemployment may remain an issue. In the neoclassical zone, shifts of aggregate demand to the right or the left have little effect on the level of output or employment. The only way to increase the size of the real GDP in the neoclassical zone is for AS to shift to the right. However, shifts in AD in the neoclassical zone will create pressures to change the price level.
Finally, consider the SRAS curve's intermediate zone. If the AD curve crosses this portion of the SRAS curve at an equilibrium point like Ei, then we might expect unemployment and inflation to move in opposing directions. For instance, a shift of AD to the right will move output closer to potential GDP and thus reduce unemployment, but will also lead to a higher price level and upward pressure on inflation. Conversely, a shift of AD to the left will move output further from potential GDP and raise unemployment, but will also lead to a lower price level and downward pressure on inflation.
This approach of dividing the SRAS curve into different zones works as a diagnostic test that we can apply to an economy, like a doctor checking a patient for symptoms. First, figure out in what zone the economy is. This will clarify the economic issues, tradeoffs, and policy choices. Some economists believe that the economy is strongly predisposed to be in one zone or another. Thus, hard-line Keynesian economists believe that the economies are in the Keynesian zone most of the time, and so they view the neoclassical zone as a theoretical abstraction. Conversely, hard-line neoclassical economists argue that economies are in the neoclassical zone most of the time and that the Keynesian zone is a distraction.
Related Topics
- Supply-Side Economics
- Say's Law
- Laffer Curve
- Neo-Classical Economics
- New Keynesian Economics
- Classical Economics
- Supply-Side Economics
- Keynesian Economics
- Keynes' Law
- Keynesian Analysis
- Demand Side Theory
- Market Forces
- Aggregate demand
- Aggregate Demand Curve (and shifts)
- Aggregate supply
- Aggregate Supply Curve (and Shifts)
- Aggregate Demand / Aggregate Supply Models
- Potential GDP
- Aggregate Supply and Demand Equilibrium
- Aggregate Supply and Aggregate Demand in Macroeconomics and Microeconomics
- Input-Output Model
- Stagflation
- Growth and Recessions in the Aggregate Demand - Aggregate Supply Model
- Unemployment in the Aggregate Demand - Aggregate Supply Model
- Inflation in the Aggregate Demand - Aggregate Supply Model
- Keynesian, Intermediate, and Neoclassical Zones