J Curve (Economics) - Explained
What is the J Curve?

Written by J. Mance Gordon
Updated at April 23rd, 2024
- Marketing, Advertising, Sales & PR
- Accounting, Taxation, and Reporting
- Professionalism & Career Development
-
Law, Transactions, & Risk Management
Government, Legal System, Administrative Law, & Constitutional Law Legal Disputes - Civil & Criminal Law Agency Law HR, Employment, Labor, & Discrimination Business Entities, Corporate Governance & Ownership Business Transactions, Antitrust, & Securities Law Real Estate, Personal, & Intellectual Property Commercial Law: Contract, Payments, Security Interests, & Bankruptcy Consumer Protection Insurance & Risk Management Immigration Law Environmental Protection Law Inheritance, Estates, and Trusts
- Business Management & Operations
- Economics, Finance, & Analytics
What is the J Curve?
A J curve is a visual depiction of a situation in which a measured factor decreases sharply over time before stabilizing and then improving quickly.
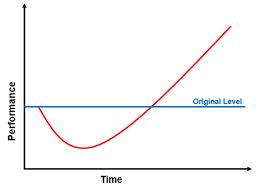
In economic theory, the J Curve has been used to demonstrate that a country's trade balance declines after devaluation of its currency before it gradually improves
The deficit will worsen because depreciation in a country's currency will have an effect on the prices of foreign imports, the prices on imports will increase while the volume of imports decreases.
Also, it depicts how the changes in the price of foreign imports will be greater than the reduced volume of imports.
This change will, however, positively affect the balance of trade because it will cause an increase in exports and decrease in imports. .
Related Topics
- Trade Balance: Surplus and Deficit
- Mercantilism
- J Curve
- National Trade Data Bank
- Capital Account (Economics)
- Merchandise Trade Balance
- Current Account
- Income Payments
- Unilateral Transfer
- Is it better to have a trade surplus or a trade deficit?
- Export of Goods and Services and Percentage of GDP
- Heckscher-Ohlin Model
- Linder Hypothesis
- The Balance of Trade as a Balance of Payments
- National Savings and Investment Identity
- Circular Flow of Money
- Financial Capital
- Supply and Demand Sides for Financial Capital?
- Flow of Capital
- Domestic Saving and Investment Determine the Trade Balance
- National Savings Identity and Trade Deficits
- How the Business Cycle Affects Trade Balances
- Trade Balance or Trade Surplus
- Level of Trade
- Comparative Advantage
- Absolute Advantage
- Specialization and Gain from Trade
- Absolute Advantage in All Goods
- Production Possibilities Frontier and Comparative Advantage
- Comparative Advantage and Mutually Beneficial Trade
- Gain from Trade
- Opportunity Costs and International Trade
- Intra-Industry Trade
- Splitting Up the Value Chain
- How Economies of Scale Lead to Trading Advantages
- Protectionism
- Closed Economy
- Tariffs
- Double Column Tariff
- Import Quotas
- Double Column Tariff
- Infant Industry Theory
- National Interest Argument
- Race to the Bottom
- Anti-Dumping Laws
- Dumping
- Trade War
- Race to the Bottom
- Non-Tariff Barriers
- Effects of Trade Barriers
- Who Is Benefited and Who is Harmed by Protectionism?
- Infant Industry Theory for Restricting Imports
- What is the Anti-Dumping Argument for Restricting Imports?
- What is the Environmental Protection Argument for Restricting Imports?
- Race to the Bottom
- Unsafe Consumer Products Argument for Restricting Imports?
- National Interest Argument for Restricting Imports
- What is the WTO?
- What is the GATT?
- What are Free Trade Agreements?
- North American Free Trade Agreement
- Central European Free Trade Agreement
- General Agreement on Free Tariff and Trade (GATT)
- Common Market
- Common Market for Eastern and Southern Africa
- Central American Common Market
- Caribbean Community and Common Market
- What are Economic Unions?
- WTO
- International Monetary Fund
- World Economic Forum
- Inter-American Development Bank
- Davos World Economic Forum
- Chamber of Commerce
- Jackson Hole Economic Symposium